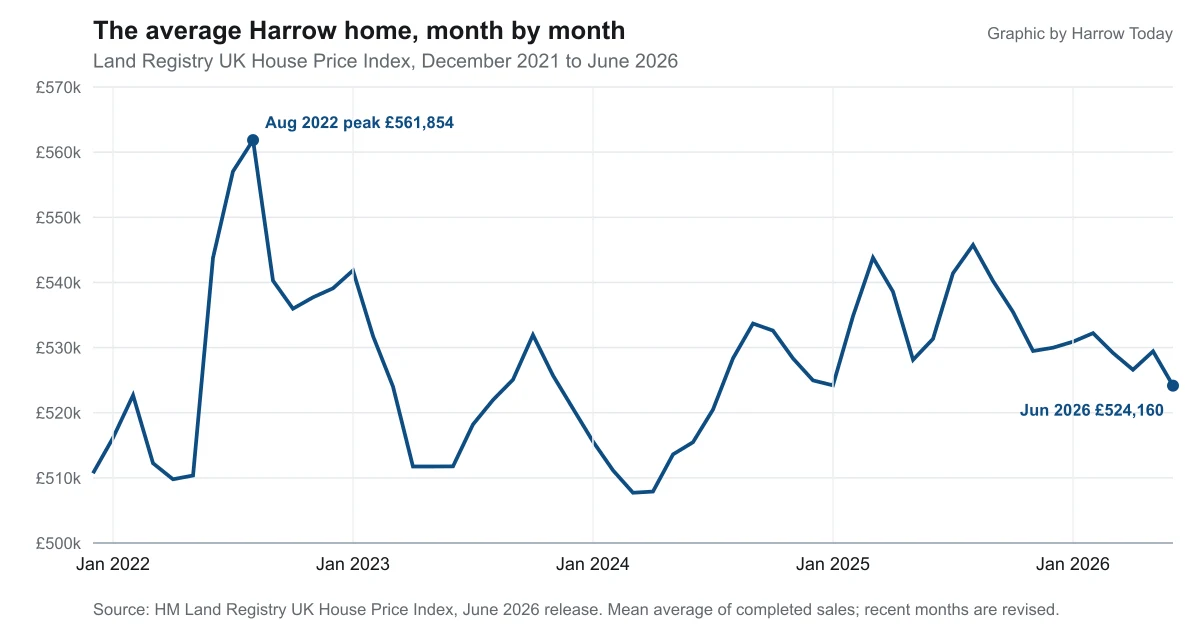

The average Harrow home sold for £524,160 in June, the borough's lowest since July 2024. Terraces are the only type still rising, and 19 London boroughs fell.
The average Harrow home sold for £524,160 in June 2026, the borough’s lowest monthly figure since July 2024. The number comes from the UK House Price Index, which HM Land Registry published on 19 August and which counts completed sales rather than asking prices.
That is £7,189 lower than a year earlier, a fall of 1.4%, and 1.0% down on May. It leaves the borough £37,694 below its August 2022 peak of £561,854, a drop of 6.7% over almost four years.
Harrow fell, but by less than London did
Nineteen of the 33 London boroughs recorded an annual fall this month, and Harrow’s was one of the milder ones. Ranked by annual change, it sits 15th of the 33, and 35th of the 295 local authority districts in England, where 62 areas fell and the rest rose.
The comparison that matters locally is with the boroughs on Harrow’s own boundary:
| Area | Average, June 2026 | Change on the year |
|---|---|---|
| Barnet | £603,753 | -2.9% |
| Ealing | £575,814 | -2.7% |
| Brent | £544,174 | -3.4% |
| Harrow | £524,160 | -1.4% |
| Hillingdon | £474,665 | -0.6% |
| Hertsmere (Herts) | £560,436 | +2.6% |
| London | £553,870 | -2.5% |
| England | £293,262 | +1.8% |
Every neighbouring London borough except Hillingdon fell faster than Harrow. Cross the boundary into Hertfordshire and the direction reverses: Hertsmere, which takes in Bushey and Radlett, rose 2.6%, and Watford rose 2.8%. Harrow remains the 18th dearest of the 33 boroughs, and about £30,000 below the London average.
Terraces are the only type still rising
The split by property type is where the borough’s market divides:
- Detached: £1,194,985, down 2.8% on the year, the steepest fall of the four
- Semi-detached: £659,603, down 0.4%, effectively flat
- Terraced: £532,719, up 0.4%, the only type that gained
- Flats and maisonettes: £318,212, down 2.7%
A first-time buyer in Harrow paid an average of £431,320, down 1.1% on the year.
Terraces and semis are the Metroland stock that fills most of Pinner, North Harrow, Kenton and Wealdstone, and they are holding up. The money is coming off the two ends of the market instead: the large detached houses in Stanmore and Harrow on the Hill, and the flats.
What it means for you
If you are selling a flat, flats have risen more slowly than terraces in each of the last five Junes. A 2.7% annual fall means the price your neighbour achieved in 2025 is not your price. If you are selling a house, the terraced figure is the encouraging one, but a 1.0% fall in a single month says buyers are not in a hurry.
If you are buying, the widest gap in the borough is between a terrace at £532,719 and a flat at £318,212. That £214,507 step is the reason so many local moves stall at the same point.
If you are just watching the number, treat any single month with care. UK HPI is a mean average, not a median, so a handful of large sales in Stanmore can move it. It is also provisional: May was first published at £530,021 and has since been revised down to £529,439, with the annual change cut from 0.4% to 0.2%. Our own Harrow house prices page, which carried the first-release May figure, has been updated to the June release.
Sales volumes tell a quieter story than prices. Harrow recorded 1,748 completed sales in 2025, almost exactly the 1,751 of 2024. The one distortion worth naming is March 2025, when 357 sales completed in a single month ahead of the stamp duty threshold change on 1 April, against 116 in March 2026. The Land Registry keeps adding completions for several months after first publication, so the most recent months in any release undercount.
The July 2026 index is due on 16 September. For what is being built across the borough in the meantime, see our Harrow planning news page.
Have your say