
The average Harrow home sold for £524,160 in June 2026, down 1.4% on the year while London fell 2.5%. Prices by type, the HA postcode ladder and time to sell.
Every Harrow street has two prices: the one in the agent’s window and the one a buyer actually paid. Only the second is a fact, and HM Land Registry records it when each sale completes. This page reads those sold-price records plainly: the borough average, what each property type goes for, how Pinner and Stanmore differ from central Harrow, and the quiet headline underneath, which is that Harrow is falling more slowly than London as a whole.
The quick answer
The average home in the London Borough of Harrow sold for £524,160 in June 2026, the latest month in the official UK House Price Index, which is built from completed Land Registry sales rather than asking prices. That is down 1.4% over twelve months, a fall of £7,189. Set it against London as a whole, down 2.5% over the same year (UK HPI), and Harrow reads as one of the steadier corners of the capital: falling, but more slowly than the capital around it.
The recent shape of the market: the borough average peaked at £561,854 in August 2022, eased through 2023, recovered through 2025 to about £546,000 that October, and has drifted down since. June 2026 is the lowest monthly figure since July 2024. Nineteen of the 33 London boroughs fell over the same year, and Harrow’s fall was the 15th steepest of them. Our full report on the June release, with the borough-by-borough comparison, is here.
What it means for you
If you are selling, houses are carrying the market and flats are not: terraces rose 0.4% over the year while flats fell 2.7% and detached houses fell 2.8% (UK HPI, June 2026). Price realistically from day one; on PropertySolvers’ Land Registry analysis the typical Harrow sale completes about £17,000 (roughly 3%) under asking and takes an average of 142 days, so a hopeful price mostly buys you a longer wait. Stanmore currently sells fastest, at around 96 days. If you are buying, the terrace is the one type still gaining; flats and large detached houses are where the negotiating room is. A first-time buyer in Harrow paid an average of £431,320 in June 2026, down 1.1% on the year (UK HPI).
Prices by property type
These are the borough averages for June 2026 from the Harrow UK HPI data, the smallest geography the official index publishes:
- Detached houses: £1,194,985 (down 2.8% on the year), the big plots of Stanmore, Pinner and Harrow on the Hill, and rarer than in any outer-London borough you would compare Harrow with.
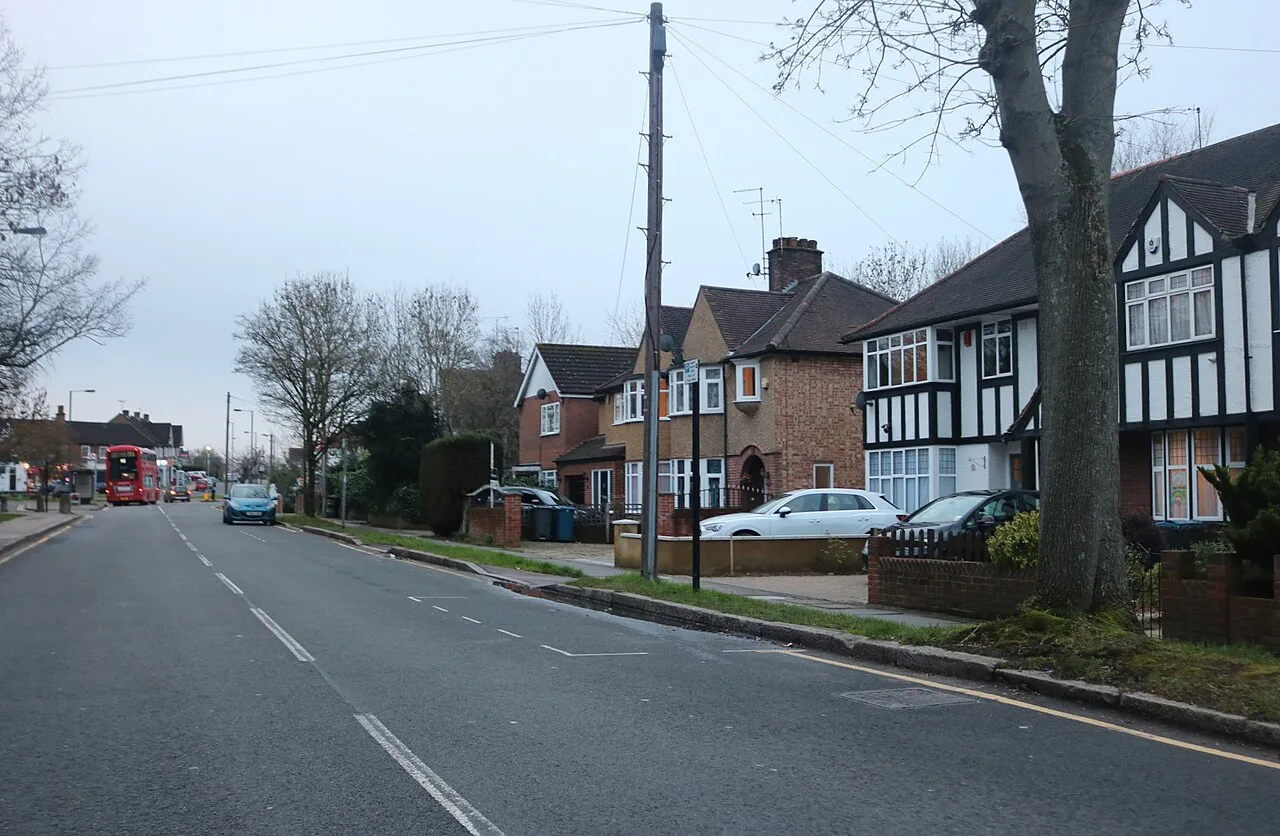
- Semi-detached houses: £659,603 (down 0.4%), the definitive Harrow home, street after street of 1930s Metroland semis from Rayners Lane to Kenton.
- Terraced houses: £532,719 (up 0.4%), the only type still rising, sitting almost exactly on the borough average.
- Flats and maisonettes: £318,212 (down 2.7%), the entry point, including the new blocks going up around Wealdstone and central Harrow that we track on our planning news page.
Harrow against its neighbours
Within the borough the ladder is real. On PropertySolvers’ Land Registry analysis, Pinner averages £481,333 (up 2.04% on the year) and Stanmore £454,083 (down 1.66%), both figures for the towns’ rolling-year sales. By postcode district the spread is wider still: HA3 (Wealdstone, Harrow Weald and Kenton) averages £710,400 and HA2 (North and South Harrow) £608,875, while HA1 around the town centre averages £525,000 and HA7 (Stanmore) £439,900, the difference being each district’s mix of semis versus flats. Across the wider HA postcode area, Plumplot’s Land Registry mapping puts the average at £560,000 for the year to June 2026, ranking HA the 13th most expensive of 105 postcode areas in England and Wales, with the cheapest sector (HA1 2, by the town centre) at £355,000 and the dearest (HA6 2, Northwood, just over the borough boundary) at £1 million.
How the market feels on the ground
Turnover has thinned sharply: Plumplot counts about 3,200 sales across the HA area in the year to June 2026, down 30% on the year before, with the busiest price band £500,000 to £750,000. Fewer sales with steady prices means sellers who price sensibly still find buyers, but there is no queue behind them. Rightmove’s Harrow sold-price page tells the same story from the portal side: an overall average of £545,593 for the last year, described as similar to the year before and about 3% above the 2022 peak, with the majority of sales being semi-detached houses at an average of £653,619.
What underpins it all is the commute: nearly every corner of the borough is on the Tube or a fast train, and our Harrow trains to London page sets out what that network actually delivers. The green edges help too; the case for a weekend here is on our things to do in Harrow page.
Frequently asked questions
What is the average house price in Harrow?
£524,160 for the London Borough of Harrow in June 2026, according to the official UK House Price Index built from HM Land Registry completed sales. Asking-price and portal averages run higher; always check which geography and which property mix a figure covers.
Are Harrow house prices going up or down in 2026?
Down, but gently: 1.4% over the year to June 2026, while London as a whole fell 2.5%. Terraces still rose (up 0.4%) while flats fell 2.7% and detached houses fell 2.8%, so the answer depends on what you own.
How much is a semi-detached house in Harrow?
The borough average for a semi was £659,603 in June 2026, with detached houses at £1,194,985, terraces at £532,719 and flats at £318,212 (UK House Price Index).
Is Pinner more expensive than Harrow?
By postcode district, no: PropertySolvers’ rolling-year averages put Pinner at £481,333 and HA5 at £455,000, below the borough average of £524,160. The premium addresses cluster instead in HA3 (£710,400 average) and around the conservation areas of Pinner village and Harrow on the Hill, where individual detached sales run far higher.
How long does it take to sell a house in Harrow?
An average of 142 days on PropertySolvers’ Land Registry analysis for Harrow, with the typical sale completing about £17,000 under asking. Stanmore is currently quicker, at around 96 days.
Where can I check what a specific house sold for?
Every completed sale in England and Wales is public. Search any street free on the HM Land Registry Price Paid service, or browse the same data on Rightmove and Zoopla.
Sources
- UK House Price Index, Harrow (HM Land Registry) for the borough average, property-type and buyer-type figures, June 2026, and the browsable Harrow UKHPI page.
- UK HPI, London and England for the regional comparators.
- Harrow house prices (PropertySolvers, HM Land Registry data) for days to sell and the asking-to-sold gap, plus the Pinner, Stanmore, HA1, HA2, HA3 and HA7 pages for locality figures.
- Harrow house prices (Plumplot, Land Registry data) for the HA postcode-area average, sales volume and sector extremes.
- Rightmove Harrow sold prices for portal-side market context.
- HM Land Registry Price Paid search to check any individual address.
Figures are provisional and revised as more sales are registered; borough, postcode-area, town and postcode-district figures cover different areas and time windows, as labelled. Always confirm the latest numbers against the linked sources before making a decision. Last checked 8 August 2026.
Have your say